I noticed that I only had 5 GiB of free space left today. After quickly deleting some cached files, I tried to figure out what was causing this, but a lot was missing. Every tool gives a different amount of remaining storage space. System Monitor says I’m using 892.2 GiB/2.8 TiB (I don’t even have 2.8 TiB of storage though???). Filelight shows 32.4 GiB in total when scanning root, but 594.9 GiB when scanning my home folder.

Meanwhile, ncdu (another tool to view disk usage) shows 2.1 TiB with an apparent size of 130 TiB of disk space!
    1.3 TiB [#############################################] /.snapshots
  578.8 GiB [####################                         ] /home
  204.0 GiB [#######                                      ] /var
   42.5 GiB [#                                            ] /usr
   14.1 GiB [                                             ] /nix
    1.3 GiB [                                             ] /opt
. 434.6 MiB [                                             ] /tmp
  350.4 MiB [                                             ] /boot
   80.8 MiB [                                             ] /root
   23.3 MiB [                                             ] /etc
.   5.5 MiB [                                             ] /run
   88.0 KiB [                                             ] /dev
@   4.0 KiB [                                             ]  lib64
@   4.0 KiB [                                             ]  sbin
@   4.0 KiB [                                             ]  lib
@   4.0 KiB [                                             ]  bin
.   0.0   B [                                             ] /proc
    0.0   B [                                             ] /sys
    0.0   B [                                             ] /srv
    0.0   B [                                             ] /mnt
I assume the /.snapshots folder isn’t really that big, and it’s just counting it wrong. However, I’m wondering whether this could cause issues with other programs thinking they don’t have enough storage space. Steam also seems to follow the inflated amount and refuses to install any games.
I haven’t encountered this issue before, I still had about 100 GiB of free space last time I booted my system. Does anyone know what could cause this issue and how to resolve it?
EDIT 2024-04-06:
snapper ls only shows 12 snapshots, 10 of them taken in the past 2 days before and after zypper transactions. There aren’t any older snapshots, so I assume they get cleaned up automatically. It seems like snapshots aren’t the culprit.
I also ran btrfs balance start --full-balance --bg / and that netted me an additional 30 GiB’s of free space, and it’s only at 25% yet.
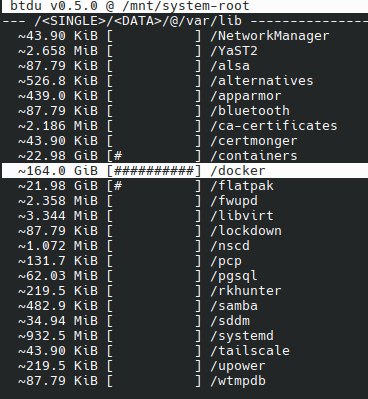
EDIT 2024-04-07: It seems like Docker is the problem.

I ran the docker system prune command and it reclaimed 167 GB!

Sorry I don’t have an answer but I like the title.
A typical quantum entangled hyperbolic non-linear file system, or QEHNLFS for short. This was first described in Einstein’s fourth relativity theory. I states the following:
In any QEHNLFS the perceived storage space (used and unused) may vary depending on the reference frame. All reference frames are equally valid and therefore the absolute storage space of the QEHNLFS is not well defined. QEHNLFSs generally appear around a central supermassive black hole, typically located at /dev/null in the QEHNLFS
Sorry, but Maxwell’s equations look wayyy better.
Probably due to too much coffee in his house.
Something… something… Schrödinger
Your btrfs snapshots are possibly counted separately by all the regular tools. They simply go into every directory they can find and add up the size of the files they see. They do not care if they are looking at an identical snapshot of the folder next to them, they simply add it all up.
Use
sudo btrfs filesystem show(and maybe add a path behind it, I am not sure). That will give you the true usage.sudo btrfs filesystem showseems to display a reasonable amount.Label: none uuid: af5f864d-2de9-48a9-b521-5923dc08c9e3 Total devices 1 FS bytes used 867.13GiB devid 1 size 922.12GiB used 921.12GiB path /dev/mapper/system-rootThis makes sense. When you use a copy-on-write block device, it is doing things below the level of the filesystem, so you have to use cow-aware tools to get an accurate view of your used disk space. For example, if you have two files that are 100% deduplicated at the cow-block level, they would show up as different inodes on the filesystem and would appear as using twice the space in the filesystem as they do on the block device. Same would go for snapshots and compressed blocks.
From the btrfs page on the archwiki
General linux userspace tools such as df(1) will inaccurately report free space on a Btrfs partition. It is recommended to use
btrfs filesystem usageto query Btrfs partitions.I confess I’m a big fan of the post title
This is a common thing one needs to do. Not all linux gui tools are perfect, and some calculate number differently (1000 vs 1024 soon mounts up to big differences). Also, if you’re running as a user, you’re not going to be seeing all the files.
Here’s how I do it as a sysadmin:
As root, run:
du /* -shc |sort -h“disk usage for all files in root, displaying a summary instead of listing all sub-files, and human-readable numbers, with a total. Then sort the results so that the largest are at the bottom”
Takes a while (many minutes, up to hours or days if you’ve slow disks, many files or remote filesystems) to run on most systems and there’s no output until it finishes because it’s piping to sort. You can speed it up by omitting the “|sort -h” bit, and you’ll get summaries when each top level dir is checked, but you won’t have a nice sorted output.
You’ll probably get some permission errors when it goes through /proc or /dev
You can be more targetted by picking some of the common places, like /var - here’s mine from a debian system, takes a couple of seconds. I’ll often start with /var as it’s a common place for systems to start filling up along with /home.
root@scrofula:~# du /var/* -shc |sort -h
0       /var/lock
0       /var/run
4.0K    /var/local
4.0K    /var/mail
4.0K    /var/opt
168K    /var/tmp
4.1M    /var/spool
5.5M    /var/backups
781M    /var/log
787M    /var/cache
8.3G    /var/www
36G     /var/lib
46G     total
Here we can see /var/lib has a lot of stuff in it, so we can look into that with
du /var/lib/* -shc|sort -h- it turns out mine has some big databases in /var/lib/mysql and a bunch of docker stuff in /var/lib/docker, not surprising.Sometimes you just won’t be able to tally what you’re seeing with what you’re using. Often that might be due to a locked file having been deleted or truncated, but the lock’s still preventing the OS from seeing the recovered space. That generally sorts itself out with various timeouts, but you can try and find it with
lsof, or if the machine isn’t doing much, a quick reboot.I tend to use
du -hxd1 /rather than-hsso that it stays on one filesystem (usually I’m looking for usage of only one file system) and descends one directory.Good thinking. That would speed things up on some systems for sure.
This is the way.
Use
dfto show disk usage.df -his most useful.I’d guess the odd usage numbers is due to sparse files. https://wiki.archlinux.org/title/Sparse_file
I’m using BTRFS with compression, so that might also explain the numbers to some extent.
I ran
df -hbut I’m not exactly sure how to interpret this. There are multiple file systems which seem to use all the space on the disk.Filesystem Size Used Avail Use% Mounted on /dev/mapper/system-root 923G 875G 29G 97% / devtmpfs 4.0M 8.0K 4.0M 1% /dev tmpfs 16G 86M 16G 1% /dev/shm efivarfs 128K 46K 78K 37% /sys/firmware/efi/efivars tmpfs 6.3G 3.0M 6.3G 1% /run tmpfs 16G 442M 16G 3% /tmp /dev/mapper/system-root 923G 875G 29G 97% /.snapshots /dev/mapper/system-root 923G 875G 29G 97% /boot/grub2/i386-pc /dev/mapper/system-root 923G 875G 29G 97% /boot/grub2/x86_64-efi /dev/mapper/system-root 923G 875G 29G 97% /home /dev/mapper/system-root 923G 875G 29G 97% /opt /dev/mapper/system-root 923G 875G 29G 97% /srv /dev/mapper/system-root 923G 875G 29G 97% /root /dev/mapper/system-root 923G 875G 29G 97% /var /dev/mapper/system-root 923G 875G 29G 97% /usr/local /dev/nvme1n1p1 511M 226M 286M 45% /boot/efi overlay 923G 875G 29G 97% /var/lib/docker/overlay2/f307539e15a1a33ca416c757e267c389450275eec9e7f945ef0d8680d162eac2/merged overlay 923G 875G 29G 97% /var/lib/docker/overlay2/8e4898a8e32696e94dd6bb5c00d02893c0b629efda7f4a8c37da2d213fe1ffab/merged overlay 923G 875G 29G 97% /var/lib/docker/overlay2/db20cdcf8192f6a6597a3ad8330273f0435db9d4acfa8e20ad65524ab075697f/merged overlay 923G 875G 29G 97% /var/lib/docker/overlay2/92ce05516bde97ae9ff6d3c6b079e7c49b6691ebcfc60b850637cab20a921ebe/merged tmpfs 3.2G 17M 3.2G 1% /run/user/1000 overlay 923G 875G 29G 97% /var/lib/docker/overlay2/5a00d8c61b23c26c87fcb3be721bc1224db7de3c9a53ae4f9bc2b922ebe40c83/merged overlay 923G 875G 29G 97% /var/lib/docker/overlay2/4f20dcdebc64c2603b5b5f6ad71e116b52e8e20af2a3fe53f9ca653421f871db/mergedTry using
btdu. I’m not sure how it works with compression, but it at least understands snapshots, as long as they are named in a sane way.Thanks for the suggestion. The repository says it is able to deal with BTRFS compression.
I do have some issues using the application. The instructions say to run it with the filesystem you want to check as argument. However, I get an error when using it with the root filesystem from
df -h --output=source,target. Runningsudo btdu /dev/mapper/system-rootgives the following error:Fatal error: /dev/mapper/system-root is not a btrfs filesystem./etc/fstabshows/dev/system/rootas being mounted on/, but it gives the same error.Do you happen to know which path I should be using (or how I can find out)?
EDIT 2024-04-07: It seems like Docker is the problem.

I ran the
docker system prunecommand and it reclaimed 167 GB!
You need to point it at a directory that has the btrfs root subvolume mounted on it (subvolid=5) although I thought it gave a different error if that was your problem.
As the other user suggested, you probably just need to mount the root subvolume somewhere and run it on that.
Unless you have multiple partitions or disks just concentrate on the one for
/. So you have 29 GiB available.Everything else is sharing the same drive for different purposes.
The beauty of BTRFS is that you can partition your disk into different parts but still actually use the whole disk for every “partition”. That makes management of snapshots easier. I think it would even enable you to combine multiple physical disks into one.
… combine multiple physical disks into one.
Isn’t that RAID 0 and generally a bad idea? Since one disk failure can bring down the whole system.
You can do “zfs style raid things” with btrfs, but there are way too many reports of it ending badly for my tastes. Something-something about “write hole”.
Probably. I never looked into how it actually works with BTRFS.
You can set the metadata and data independently as RAID0, RAID1 or other levels depending on the number of disks and your desired level of data loss risk.
It could be that hardlinked files are being double-counted. What software manages that snapshot folder?
I’m using BTRFS with snapper.
Maybe it’s time to clean out some old snapshots in Snapper.
sudo snapper listshows 1 snapshot without a date, 1 old one, and 10 taken in the past couple of days before and after zypper transactions. It seems like they get cleaned up automatically.
There’s hardlink, and then below that there’s the COW/dedupe version called “reflink”. Two files can point to the same chunks of data (extents), and altering one does not alter the other. Two files can point to just some of the same chunks of data, too. I don’t think there is much indicator for when this is happening, besides the free space vs used space accounting looking crazy. If you “compsize” two reflinked files at once, it’ll show you the difference.
Well, maybe you just have a non-measurable set as filesystem 😅
If you’re using compression, try compsize.
Look at this:
https://gitlab.com/TheEvilSkeleton/flatpak-dedup-checker
I think that has some BTRFS stuff in it to display actual size with deduplication
BTRFS support in Filelight/kio is pretty important.
Use df and du
Those don’t work properly due to BTRFS snapshots and compression.
compsize will give you an honest overview of what’s going on with btrfs.
when summing up totals, docker containers and snaps are likely counted twice in some programs: they have volume files that are counted once and then those are mounted as file systems and their contents can be counted again in the mount point.
Just a heads up: I’ve noticed that Steam tends to require a bunch of spare space beyond the size the game takes up.


